Increase your App’s performance with React hooks and the React Dev Tools

When building a React application you will notice that as the number of nested components grows, some parts of your interface tend to to get slow and less Reactive. This is because the browser needs to re-render more components when the user interacts with elements that change state higher in the component tree.
In this article I will tell you how you can prevent unnecessary re-renders through memoization and make your React application lightning fast. ⚡
For a client project at CLEVER°FRANKE (opens in a new tab) I’ve been working on a filter component that includes a histogram that is based on the number of steps in the filter.

HistogramFilter component
I noticed that when dragging the filter handlers, the frame rate dropped enormously which made the component practically unusable. So I decided to investigate what was going wrong.
In order to know where to start looking, it is important to understand what actually happens when the user drags the filter handler. React uses virtual DOM (opens in a new tab)s that represent actual elements in the DOM. Whenever a user interacts with a UI element the state of the application changes. React will walk through all components that are affected by this state change to calculate a new version of the virtual DOM. It will compare the previous and the new version and if any differences are found it will update that change into the actual DOM itself. This process is called reconciliation (opens in a new tab).
The manipulation of DOM elements is a pretty expensive task. But also walking through all render methods of affected components can be very time consuming, especially when heavy calculations are being made in the render methods. So we should try to minimise these so-called wasted renders as much as possible.
Back to our use case: since the state of the filters is handled by a parent component my hypothesis was that there were probably unnecessary renders and calculations being made. To quickly check if this is the case we can use the Chrome Dev Tools. It has a feature called Paint Flashing which highlights the DOM changes that are being made. You can temporarily enable via the Rendering tab:

Enable Paint Flashing in the Chrome Dev Tools
Once enabled the browser will show you which elements are being repainted. In my case it looked like this:

Paint Flashing filter components
This is looking as it should, only the filter component that I’m using is causing DOM manipulations. So to browser doesn’t have to do any unnecessary painting when changing the slider. We’ll have to investigate further to see what is causing the problem.
To get an even better view on what React components are being re-rendered we can use a somewhat similar tool which is included in the React Dev Tools (opens in a new tab). It’s called Highlight Updates and it can be found in the preferences panel in the React Dev Tools. Once enabled it will highlight all components that are being rendered. The colours will even indicate if the render took a lot of time.

Highlighting updates filter components
React Developer Tools lets you inspect the React component hierarchy, including component props and state.
It exists both as a browser extension (for Chrome (opens in a new tab) and Firefox (opens in a new tab)), and as a standalone app (opens in a new tab) (works with other environments including Safari, IE, and React Native).
This clearly indicates what is going wrong: when I drag one filter my application renders the other filter including the histogram as well. That is wasted processor power and should therefore be avoided. Especially in the case of heavier components such as the histogram.
So now we know what is going wrong, but we do not yet know what is causing the UI to respond so slow. To see why, we can use the Performance panel in the Chrome Dev Tools. This lets you record a specific action and enables you to zoom in on the specific tasks the browser has to perform during a specific frame.
Going into detail about how you can use the Performance panel is outside the scope of this article. But you can find a useful getting started tutorial here (opens in a new tab).
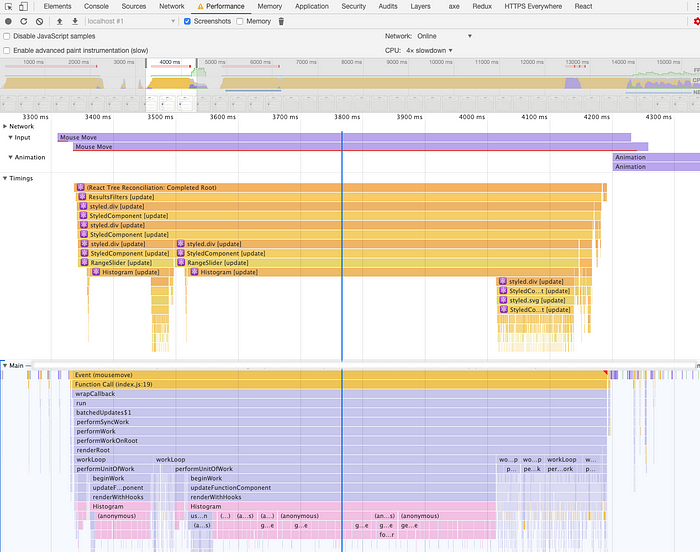
I’ve used the Performance panel to record a single step change in the filter component. When I zoom into my mouse move action I got the following results:

Performance panel flame graphs 🔥
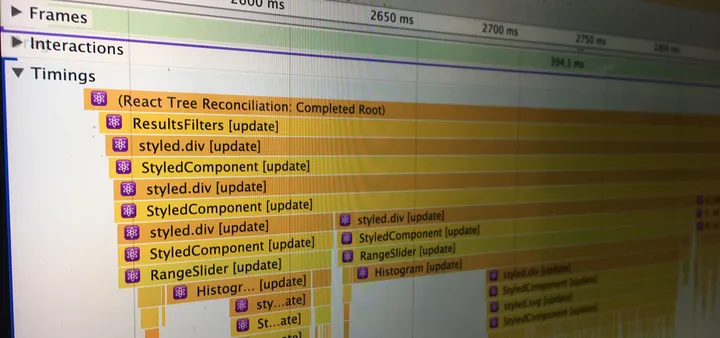
As you can see it displays two flame graphs, which are both more or less the same. The first graph (under Timings) shows the actual mounting and updating of React components. We can see this extra graph because React makes use of the User Timing API (opens in a new tab). The second graph shows all the tasks that are performed on the main thread and is much more detailed.
I prefer to use the first graph to see what components are performing poorly and the second one to dive into more detail on which actual functions and calculations are taking up more time.
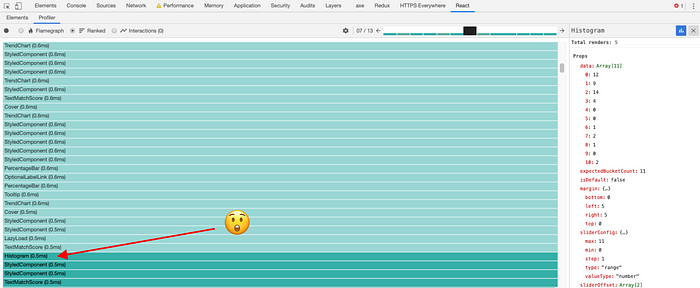
The default Performance tab flame graph may look very intimidating when first using it. Luckily The React Dev Tools have a similar feature, which also allows you to create the same flame graph based on the User Timing API via it’s Profiler tab. I think it is a lot easier to understand and it gives you some nice extra features:
- It allows you to get a ranked list of all components based on their rendering time (see screenshot).
- It lets you easily skip through different recorded renders easily.
- You can click on specific components to see what their props were during specific renders.

Components ordered by render time
All graphs above clearly indicate what component is causing the problem: Histogram. Especially rendering the second histogram (the right one) is taking up a lot of time (402.8ms!) and I’m not even dragging that one. We have detected the problem! Now it is time to fix it and optimise the components performance.
Note that I’m recording the performance with CPU throttling enabled at 4x slowdown to mimic users that are not using the latest Macbook Pro and to accentuate any performance issues.
To prevent wasted renders from happening we can optimise our components by memoizing them. To do so we can use React.memo to memoize components and the memoization React hooks useMemo and useCallback to memoize variables and functions.
React.memo
Since React 16.6.0 we can use the React.memo higher order component (opens in a new tab). It is the equivalent of React.PureComponent but is used for function components instead. Since the React community is moving away from class components in favour of function components in combination with hooks this is the one to use.
When you wrap a function component with React.memo it will shallow compare the props that are passed. Only if the compared props are not equal it will re-render the component. You can also pass a callback function as a second parameter to write your own comparison method. This should however be used with caution because you can end up with unexpected bugs.
It makes sense to split up your components into smaller components and wrap them each of them with React.memo. This way you can make sure only parts of the component need to re-render when props change. Don’t go and try to memoize everything though because the props comparison can take up more time than the rendering itself.
In my case I’ve wrapped the filter component (RangeSlider) and the Histogram component with React.memo. Furthermore, I’ve split up the histogram into a wrapper component and a HistogramBuckets component to separate logic and presentation.
const RangeSlider = React.memo((props) => {
  //...
});
Memoization hooks
React 16.8.0 brought us the power of hooks and with it the power to easily memoize values and callback functions inside your components. Before hooks were introduced you could of course use a separate library for that, but because it’s part of the React library itself now it is much easier to integrate and to make it part of your workflow.
useMemo will memoize a value so that it doesn’t need to be recalculated during the next render. useCallback does the same thing but than for callback functions. You can pass both hooks a dependency array that contains values from the component scope (such as props and state) that are being used inside the hooks. React will compare these dependencies on every render and once they change it will update the memoized value or function.
Note that React is using the Object.is comparison algorithm (opens in a new tab) to do the props comparison as fast as possible. This means that if you pass new instances of Objects or Arrays as props it will return
falseduring comparison and thus recalculate the memoized value.
Passing memoized props
In the our example the filter components needed a few optimisations before the React.memo comparison worked as it should. This was basically how my parent component was setting the props:
function handleChange(value => {
  //...
});

<RangeSlider
  value={[minValue, maxValue]}
  onChange={handleChange}
/>
On every render an instance of handleChange was created and a new Array instance was passed as the value prop. This caused the RangeSlider component to always update despite that it was wrapped in React.memo, because Object.is() comparison would always return false. To properly optimise it I had to refactor it to the following code:
const handleChange = useCallback((value) => {
  //...
}, []);

const value = useMemo(() => [minValue, maxValue], [minValue, maxValue]);
<RangeSlider value={value} onChange={handleChange} />;
handleChange will now only update on mount because of the empty dependency array. value will return a new Array whenever minValue or maxValue changes.
I’ve applied the same kind of optimisations in the Histogram component that is passing props to HistogramBuckets.
Bonus tip💡: To quickly check which props are different between renders you can use this nifty hook: useWhyDidYouUpdate (opens in a new tab).
By adding these quick and easy optimisations I’ve been able to improve the performance of my components enormously. After memoization the render time of the Histogram component during the exact same user interaction is decreased to 0.5ms. This is a ~1000 times faster 🤩 than the original 72.7ms plus the extra 402.8ms for the second histogram. The result is a much smoother user experience with only minimal effort.

Histogram render time after memoization